documentation
Appendices
A1: References: Phantom Solution Recipes and Matching
Detuning experiments were run at home (due to the Covid-19 pandemic), in a do-it-yourself (DIY) fashion. For use cases such as pet or cattle tracking, the detuning induced by human tissue becomes an important performance factor, therefore a sucrose-based phantom solution was prepared. The National Institute of Health in Maryland has published a phantom solution calculator, for both sucrose and PVT-based recipes. It is available on: https://amri.ninds.nih.gov/cgi-bin/phantomrecipe.
The resonant frequency of human tissues is tabulated in this study: https://www.emf-portal.org/en/cms/page/home/effects/radio-frequency
The conductivity is tabulated in this study: https://drum.lib.umd.edu/bitstream/handle/1903/3532/umi-umd-3365.pdf on Table 2.3 on Page 10. An extract is here:
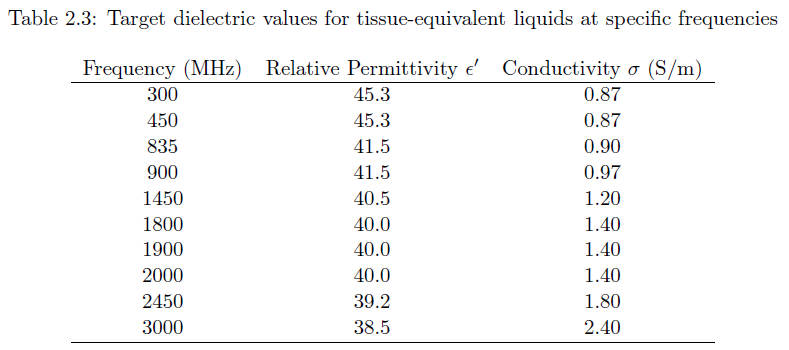
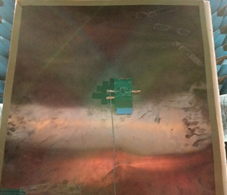
The following body phantom solution was prepared and boiled for a couple of minutes:
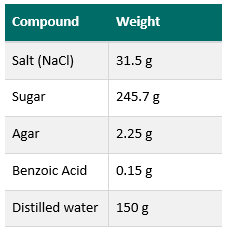
Voilà!
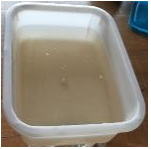
It is important to confirm that the RF characteristics of the solution match those that occur when the antenna is close to an actual body. To this end, the 90mm board was alternately placed 10mm above the phantom solution (poured into a household plastic box, whose RF characteristics are experimentally verified to be negligible), then on my thigh. The reflection coefficient was measured at all three frequencies of interest:
|
|
|
|
On phantom solution |
On body (thigh) |
|
|
LoRa Body (Pink) Phantom Solution (Red) |
|
|
GNSS Body (Red) Phantom Solution (Pink) |
|
|
Wi-Fi Body (Red) Phantom Solution (Pink) |
_Body_Phantom_to_Body-all_frequencies.png)
_Body_Phantom_to_Body-all_frequencies.png)
_Body_Phantom_to_Body-all_frequencies.png)
These results indicate a reasonable fit of the recipe for all three frequency bands of interest.
A2: Active Antenna Testing Validates Passive Antenna Testing
As described above, in the section What Makes an IoT Device Radiate Properly?, improper load on an integrated power amplifier may reduce its performance. Hence, the natural step at the end of the design cycle is to run “Active Antenna Tests”.
In a passive antenna test, the wireless transceiver used in the IoT device is replaced with lab equipment such as a signal generator:
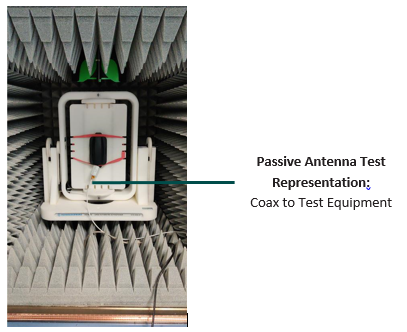
This method, applied with all the relevant caution, gives good results, and a proper estimation of the antenna efficiency is possible.
However, when the objects to be measured become smaller, the test harness (sourcing equipment and its cable, temporarily attached to the IoT device) may significantly impact the results. On top of this, the effect of mismatch on the actual PA is not measured.
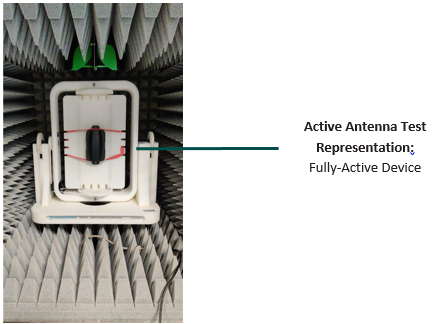
In an active antenna test, there is no test harness connected to the device. Instead, the active module on the test board, here the FMLR-1110-X-L07 module, generates the carrier used to measure the antenna performance in the chamber. Consequently, the results obtained in terms of efficiency, e.r.p., and radiation pattern will be 100% representative of the actual use of the device in the application.
Although this paper does not cover this aspect, we are hoping to back-up these measurements with active antenna tests in some of the many conditions covered in this document.
A3: Results Obtained by Simulation
Ignion Antennas offers a free simulation service, called Wireless Fastrack. This service consists of providing a proof-of-concept to IoT designers, to give them an order of magnitude of the expected antenna performance for their PCB size. The service guides them in the proof phases of their projects to get the most efficient antenna designs that meet their expectations. It also includes the most appropriate Virtual Antenna component selection, together with design recommendations for its appropriate integration, recommended matching network topology and bill of materials, as well as estimated antenna performance.
Below are the results obtained for the reference case study above (PCB of 90mm x 50mm) using the Wireless Fastrack service. Both simulations and measurements are in agreement for LoRa and GNSS. In the Wi-Fi bands some differences appear, mainly because, at these high frequencies any element can affect performance, this is the case for the cables and SMA connectors not modelled during the simulation process, but present in the measurement set-up. Nevertheless, the level of agreement is still good and provides a very fast preliminary analysis to have an order of magnitude of the expected performance in your device. The service is provided in 24 hours from the reception of the Wireless Fastrack request (subject to terms and conditions).
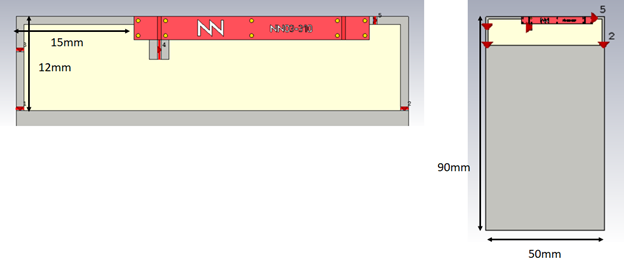
Image courtesy of Ignion Antennas
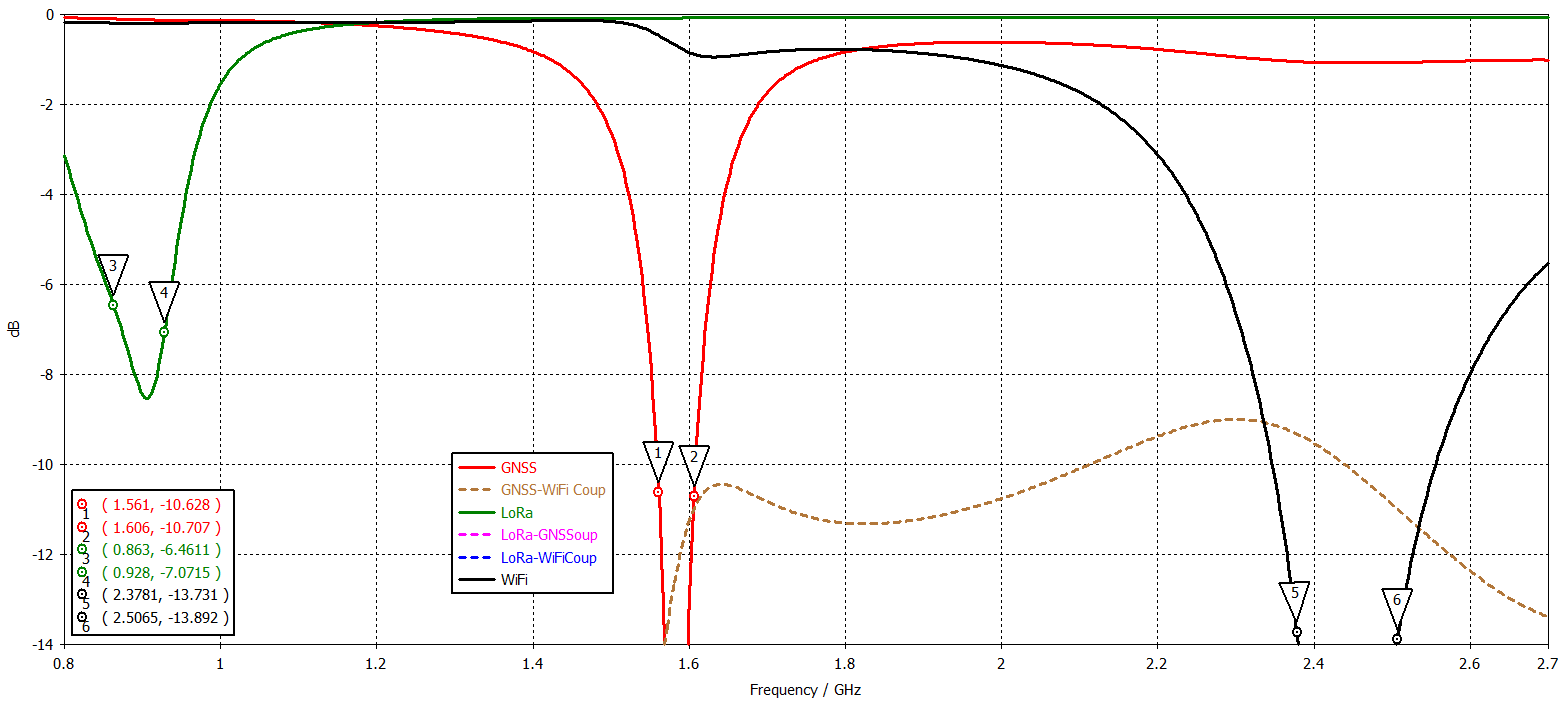
Image courtesy of Ignion Antennas
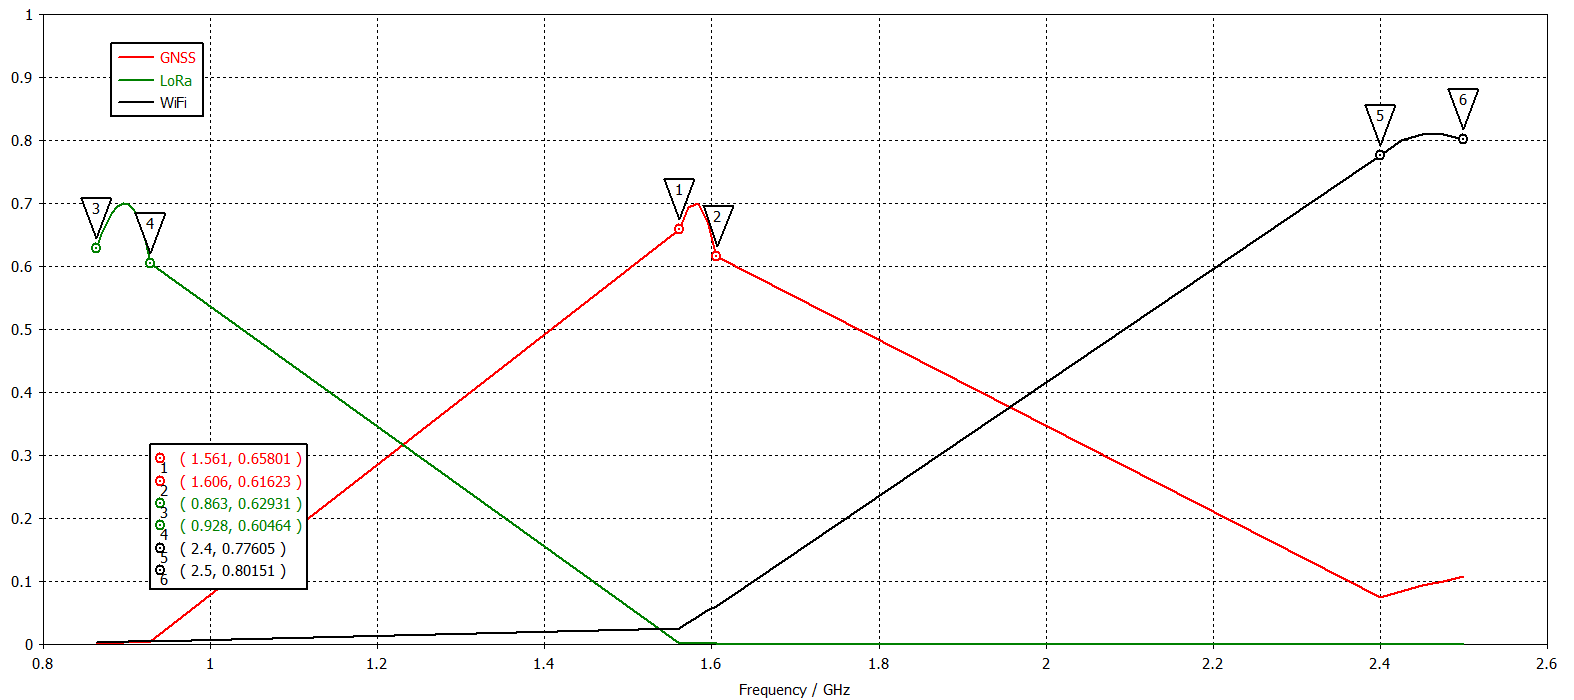
Image courtesy of Ignion Antennas
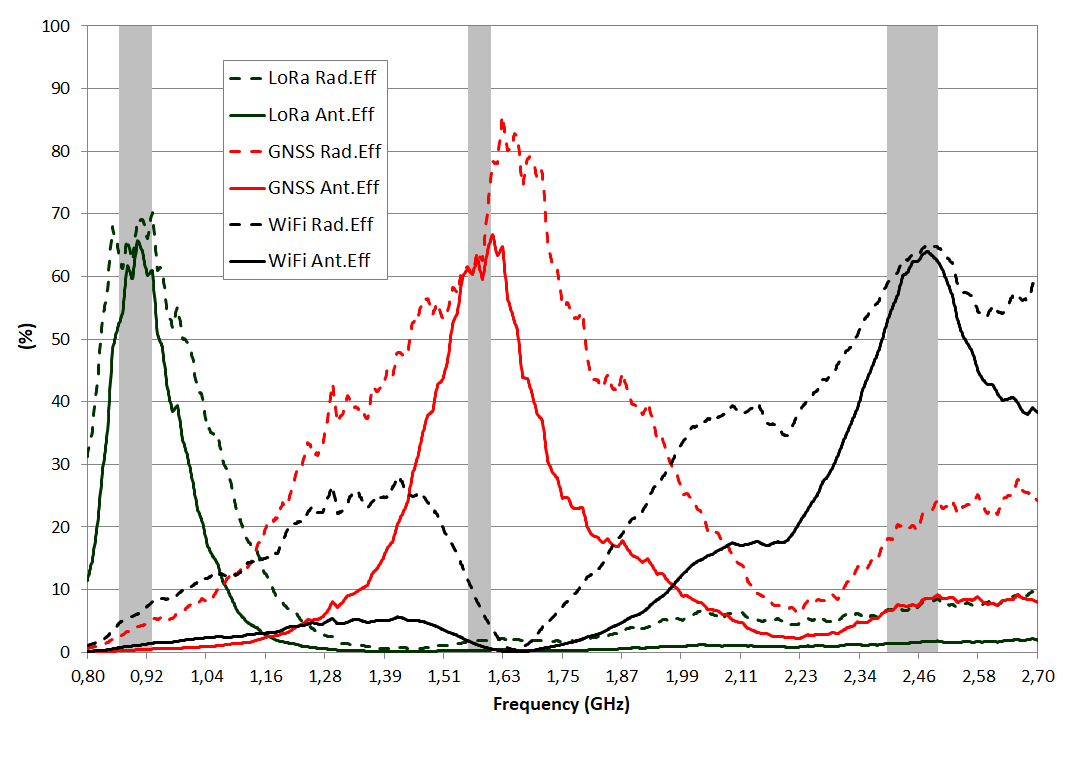
Image courtesy of Ignion Antennas
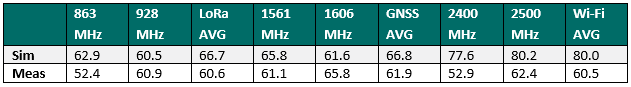
The table below shows the comparisons for simulated and measured results for the frequencies indicated.
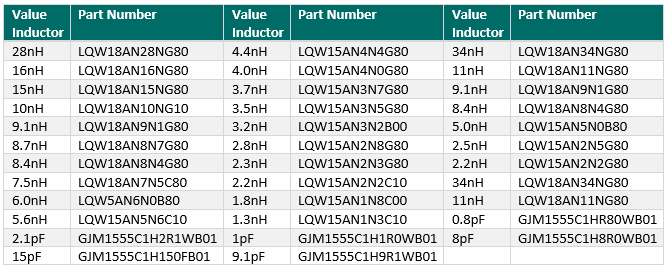
A4: Passive Element Part Numbers
The following capacitors and inductors, from Murata, were used during the experiments:
L and C Commercial References:
A5: 10mm Placement Tests for Metal Case
Although metal impacts performance, we can minimize this impact if the PCB is placed in the corner of the metal surface. In this experiment the PCB is 10 mm from the metal and the matching network used is the one shown in the Board-size Impact: Matching and Resonance section. Results would be even better if the distance between the PCB and the metal surface was greater.
|
|
|
|
PCB in the middle |
PCB on the corner |
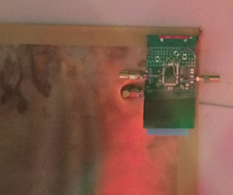
Images courtesy of Ignion Antennas
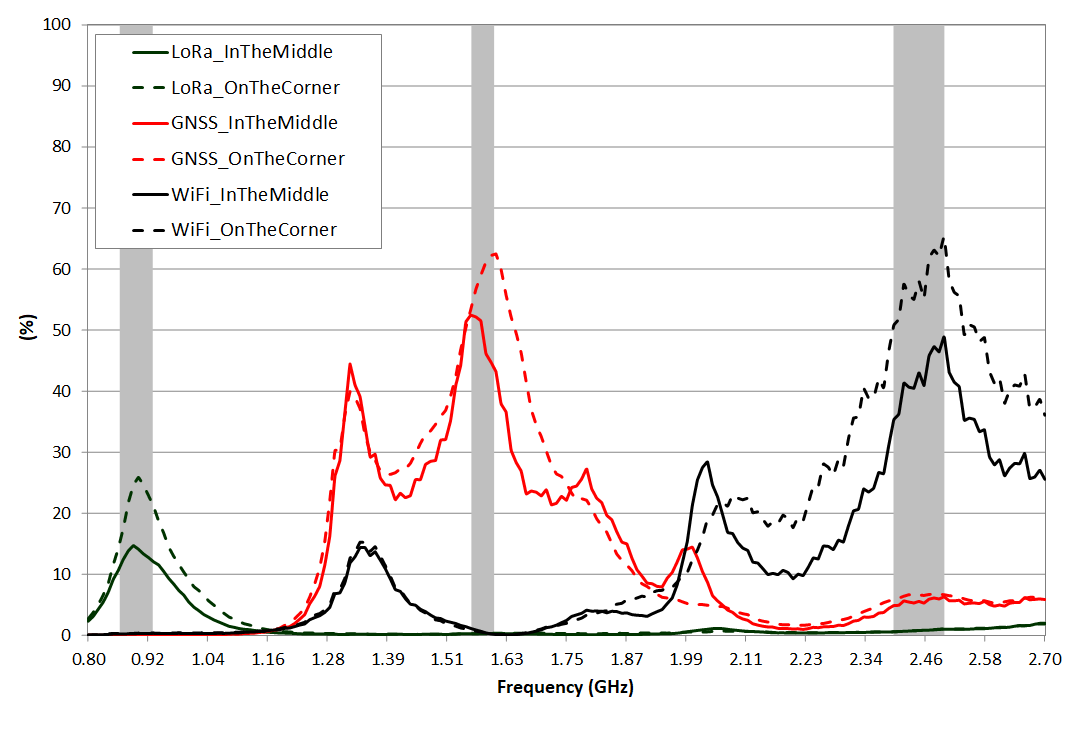
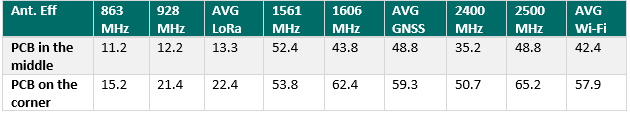
The following graph and table show the measured efficiency of the antennas for each of these placements.
Images courtesy of Ignion Antennas
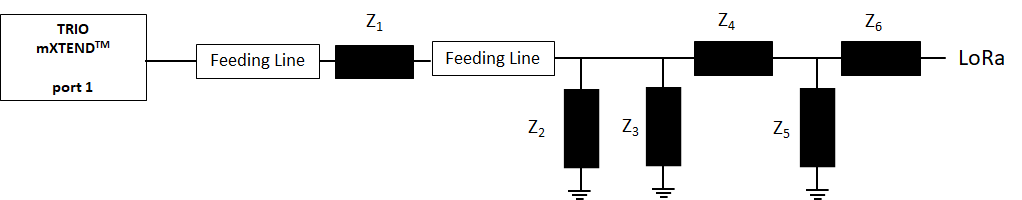
A6: Alternative Matching for the 90mm Board
The following matching was used for the detuning experiments on the 90 mm board:
|
|
||||||||
|
LoRa Matching Network |
||||||||
| Z1 | Z2 | Z3 | Z4 | Z5 | Z6 | |||
| 90x50 | 8.4nH | 15pF | 2.5nH | 8pF | 5nH | 0Ω | ||
|
|
||||||||
|
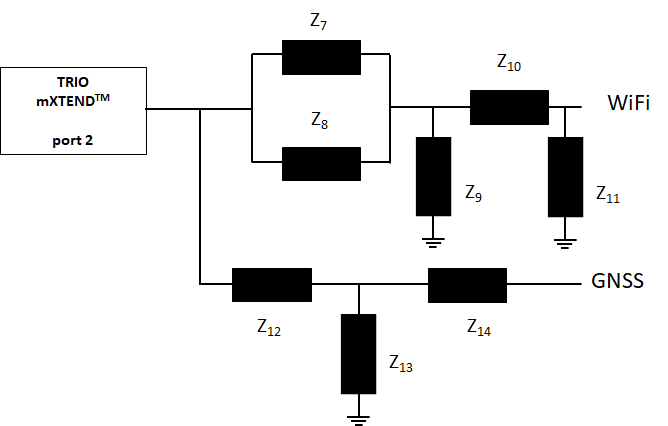
GNSS & Wi-Fi Matching Network |
||||||||
| Z7 | Z8 | Z9 | Z10 | Z11 | Z12 | Z13 | Z14 | |
| 8.4nH | 1pF | 9.1nH | 2.2nH | OPEN | 11nH | 2.1pF | 2.2nH | |
|
|
||||||||
|
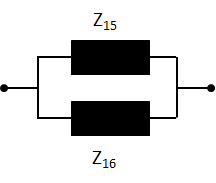
GNSS & Wi-Fi Matching Network |
||||||||
| Z15 | Z16 | |||||||
| 0.8pF | 34nH | |||||||
Images courtesy of Ignion Antennas