documentation
LoRa Edge Tracker Ref Design - User Guide documentation (v2)
Hardware Overview
Recommended Operating Conditions
Item |
Minimum |
Maximum |
Unit |
|---|---|---|---|
Maximum supply voltage |
3.6 |
V |
|
Operating temperature |
-40 |
+60 |
°C |
Max current |
150 |
mA |
|
Idle current |
10.8 |
μA |
|
Maximum transmit output power |
+22 |
dBm |
|
Min RF input level for LoRa® detection SF7 BW 125kHz |
-127 |
dBm |
|
Min RF input level for LoRa detection SF12 BW 125kHz |
-140 |
dBm |
|
Min RF input level for GNSS detection |
-140 |
dBm |
|
Min RF input level for IEEE 802.11b detection |
-92 |
dBm |
Certification
The Tracker has been certified in the following regions:
Tracker Reference |
Region |
Certification Number |
|---|---|---|
LR1110TRK1CKS |
US-915 |
2AMUGLR1110TRK |
LR1110TRK1BKS |
EU-868 |
self declaration, ETSI compliance testing performed by certification laboratory |
LR1110TRK1BKS-IN |
IN-865 |
based on ETSI compliance |
LR1110TRK1CKS-JP |
JAPAN |
201-210748 |
LR1110TRK1CKS-AU |
AU915 |
based on ETSI compliance |
LR1110TRK1CKS-KR |
KR920 |
R-R-sq3-LR1110TRK1CKS |
Architecture
The Semtech LoRa Edge™ Tracker Reference Design architecture has the following characteristics:
LR1110 with Wi-Fi and GNSS capabilities
GNSS antenna diversity
Patch antenna
PCB antenna
STM32WB55 with BLE for tracker configuration and update
2400mAh battery (2x 1200mAh)
52 x 85 x 27mm IP66 housing
LEDs
3-Axis & Hall Effect Sensors
Maximum transmit output power = +22dBm
Typical sensitivity level:
LoRa:
-140dBm at SF12 BW 125kHz
-127dBm at SF7 BW 125kHz
GNSS: -140dBm
Block Diagram
Figure 7: LoRa Edge Tracker Reference Design Block Diagram*
The control signals from/to the MCU and the Semtech LR1110 are:
1 x SPI, coming from the MCU to the LR1110 SPI interface
LR1110 interface Reset / IRQ / Busy line
I2C coming from the MCU to the accelerometer sensor
GPIO for the Hall Effect sensor and user button
Control lines for RF switch:
Two from the MCU, for GNSS antenna diversity and Wi-Fi/BLE selection.
One from the LR1110, for LoRa RX/TX path selection.
Power Consumption
Mode |
Description |
Typical Current Consumption |
Unit |
|---|---|---|---|
Sleep mode without super cap |
10.85 |
μA |
|
Sleep mode with super cap |
18.85 |
μA |
|
Tx on at 22dBm 915mHz (HP_LF) |
TX Continuous |
130 |
mA |
Tx on at 14dBm 868MHz (HP_LF) |
TX Continuous |
86 |
mA |
TX BLE on at 0dBm |
Advertisement |
11.1 |
mA |
Wi-Fi scan |
12.2 |
mA |
|
GNSS scan (Semi coherent research phase) |
15.2 |
mA |
|
GNSS scan (Coherent research phase); LNA ON during this phase |
5.8 |
mA |
To change between High Power (HP) and Low Power (LP) paths, you must change the BOM (R3 for HP and R4 for LP). By default, the LoRa path is connected to the HP path which delivers 22dBm output power.
Power Consumption Profile
This section describes the typical power consumption profiles with standard parameter settings.
Note
The power consumption of the LoRa radio is not addressed here because it depends on the region where the Tracker is deployed and the Adaptive Data Rate (ADR) strategy that is used.
Scan with Default Parameters
The power consumption profiles have been recorded with the following configuration:
GNSS Scan mode type: Assisted
GNSS constellation: GPS + Beidou
GNSS Scan mode: LR1110 Advanced scan mode
GNSS Search mode: LR1110 GNSS best effort mode
GNSS Antenna selection: PCB
Wi-Fi Channels: ALL
Wi-Fi Max result: 6
Wi-Fi Timeout per scan: 90ms
Wi-Fi Timeout per channel: 300ms
Figure 8 shows the power consumption profile using the default parameters when the Tracker is outdoors in mobile mode. When outdoors, the GNSS scans give results, and the location is done by GNSS (For information on the scan strategy, see Tracker Application Capabilities).
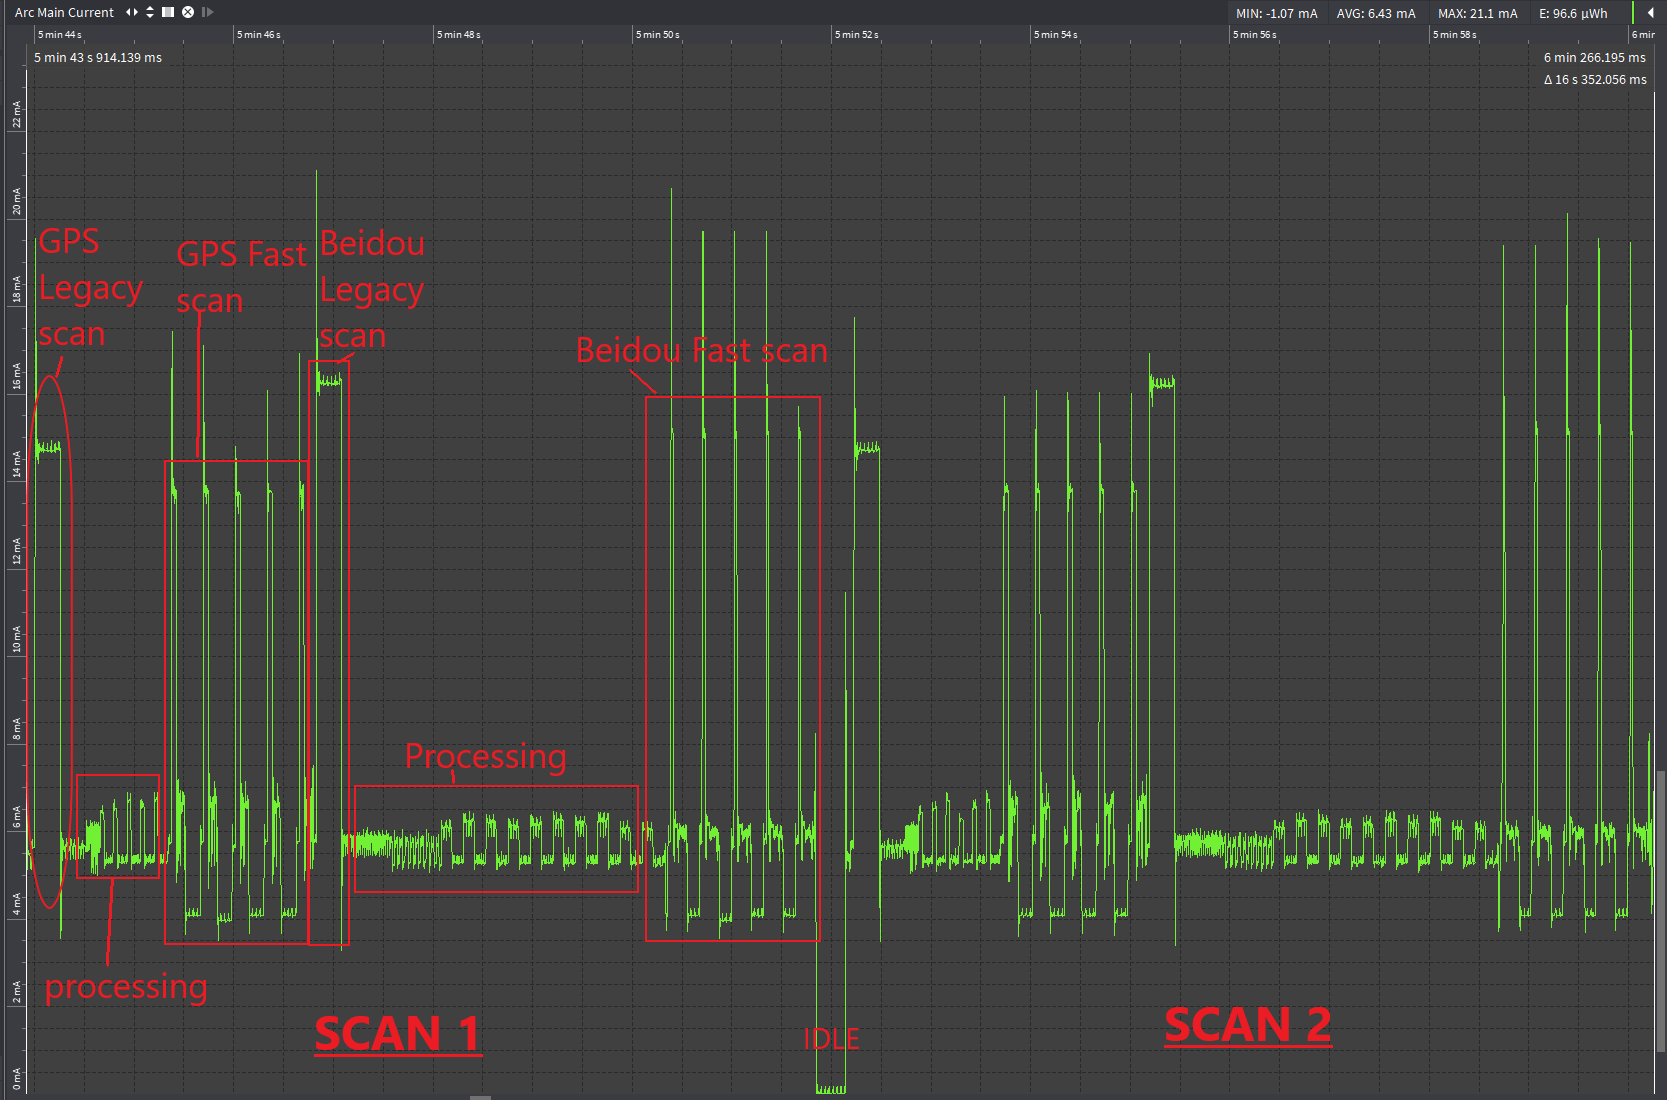
Figure 8: Power Consumption Profile Scan using Default Parameters in Mobile Mode, Outdoor Case
If the scan completes after only two GNSS scans (no Wi-Fi scan required because the GNSS is good enough) the power consumption is about 6.43mA / 16.353s; therefore, 29.3μAh.
Note
The power consumption varies depending on the number of GNSS satellites detected.
LoRaWAN® transmission is not treated here because it varies depending on the region used.
Figure 9 shows the power consumption profile using the default accuracy parameters when the Tracker is indoors in mobile mode. When indoors, GNSS scans don’t give results, so the location is done by Wi-Fi (For information on the scan strategy, see Tracker Application Capabilities).
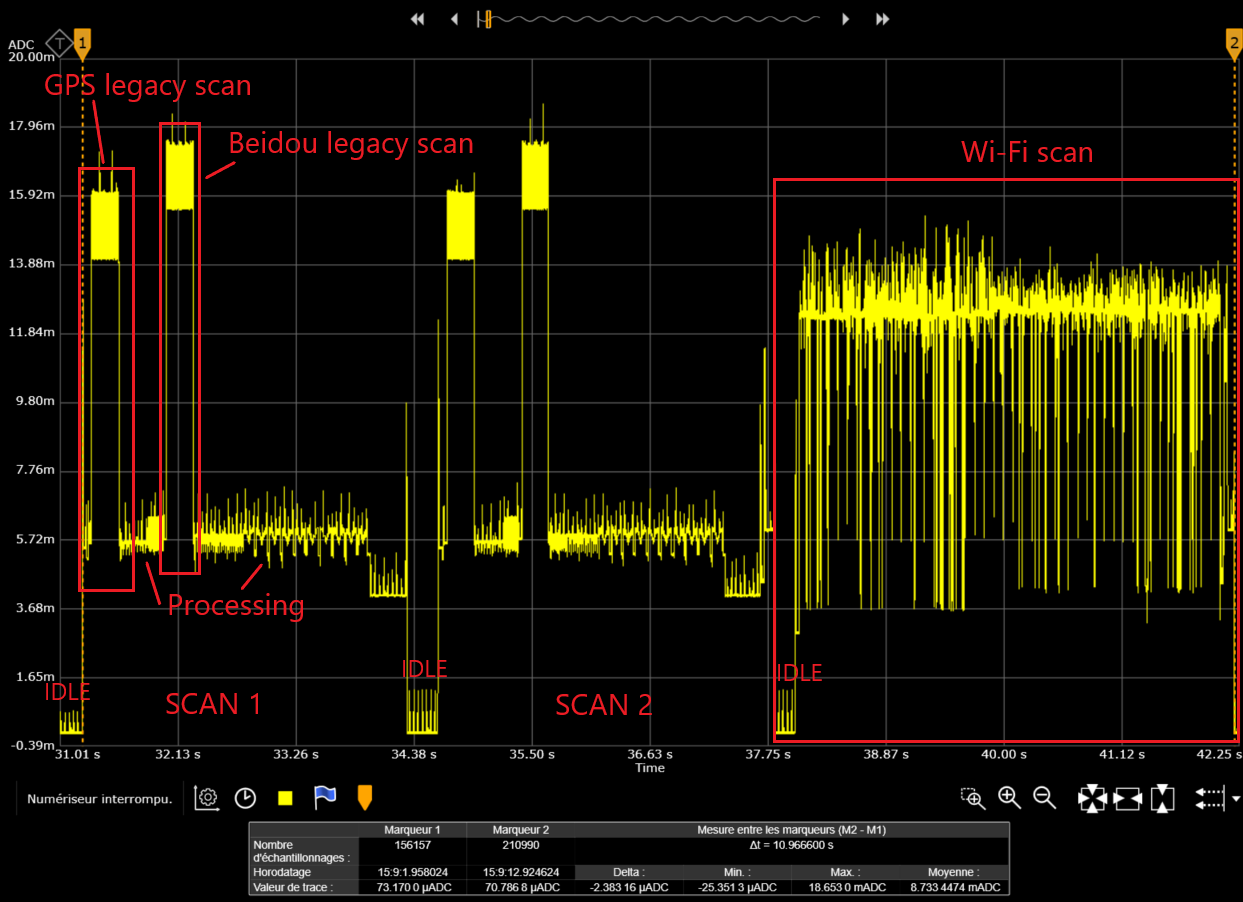
Figure 9: Power Consumption Profile Scan using Default Parameters in Mobile Mode, Indoor Case
The complete scan power consumption is about 8.71mA / 10.92s; therefore, 26.5μAh. If we split the power consumption by functionality, we get:
GNSS Scan: (7.26mA / 3.08s), corresponding to 6.21μAh per scan; in mobile mode we have two scans so 12.42μAh.
Wi-Fi: 12.2mA / 3.98s, corresponding to 13.6μAh.
Idle: 10.8μA.
Note
The power consumption varies depending on the number of Wi-Fi access points detected.
LoRaWAN transmissions are not treated here because they vary depending on the region used. The difference between the total and the sum of all split parts is due to the idle state duration.
Figure 10 shows the power consumption profile using the default parameters when the Tracker is outdoors in static mode. When outdoors, the GNSS scans give results, and the location is done by GNSS (For information on the scan strategy, see Tracker Application Capabilities).
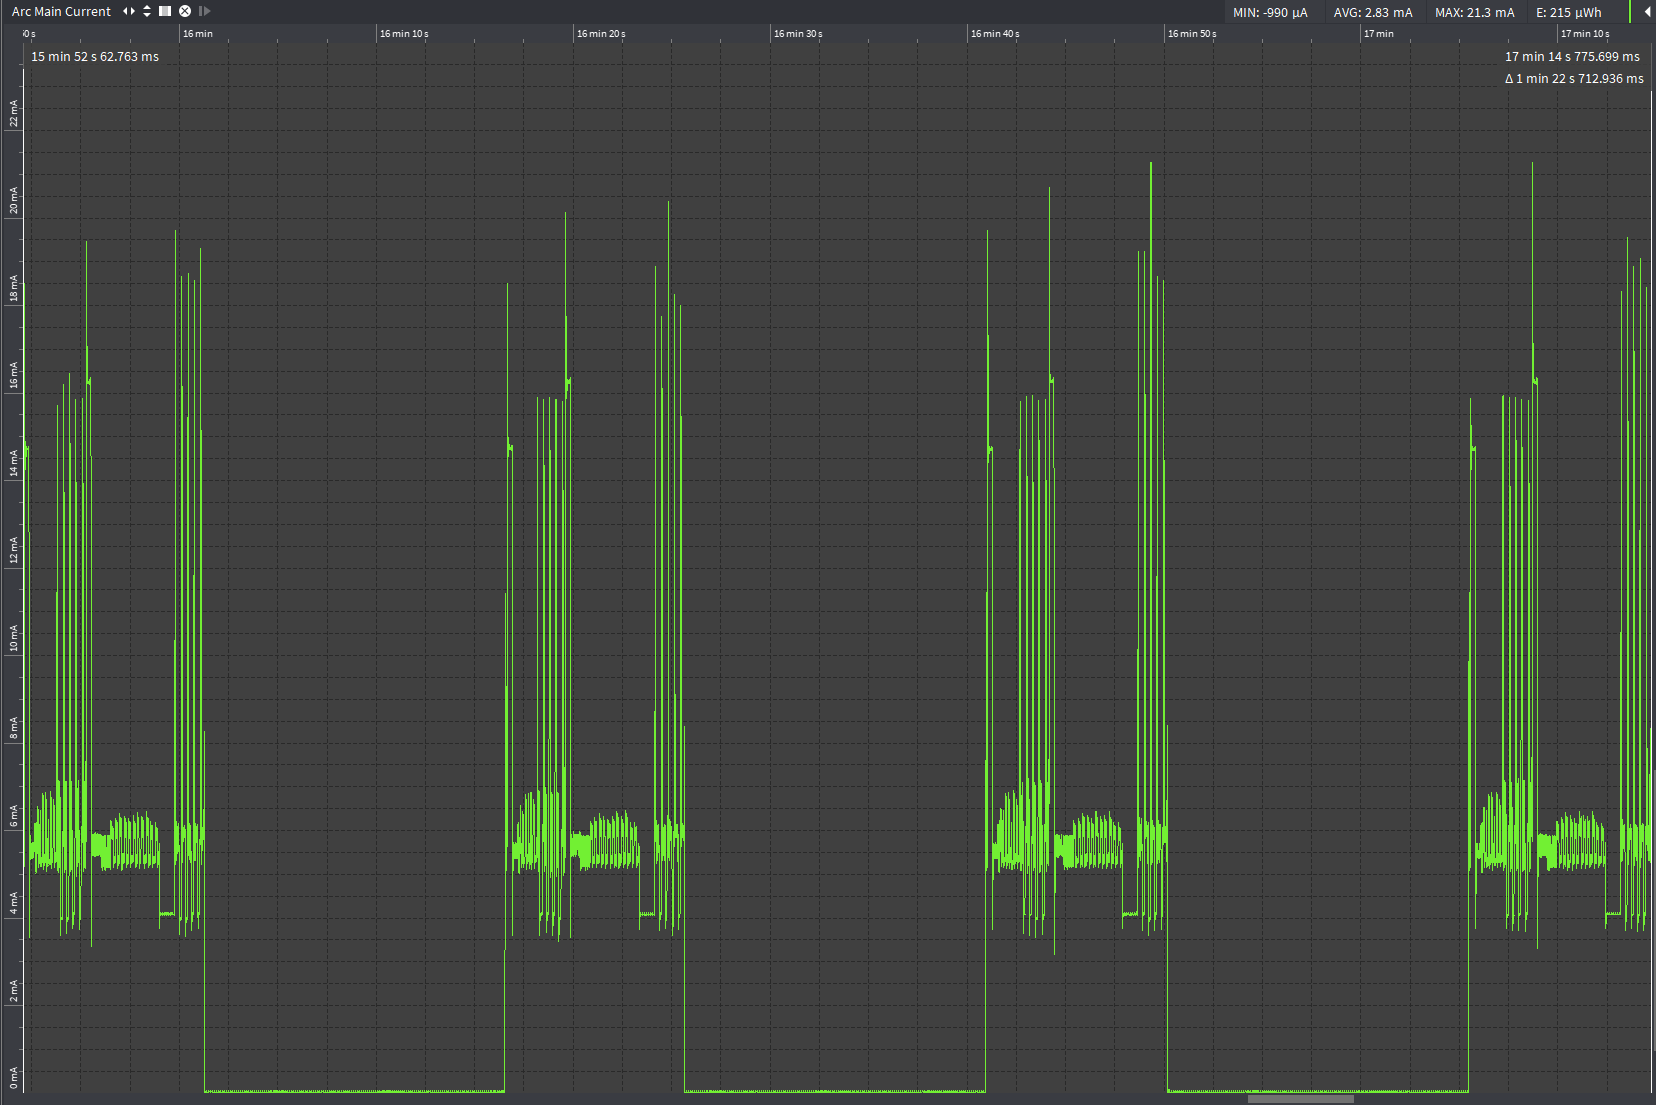
Figure 10: Power Consumption Profile Scan using Default Parameters in Static Mode, Outdoor Case
If the scan completes after only two GNSS scans (no Wi-Fi scan required because the GNSS is good enough), the power consumption is about 2.83mA / 82.7s; therefore, 66.5μAh.
Note
The power consumption varies depending on the number of GNSS satellites detected.
LoRaWAN transmission is not treated here because it varies depending on the region used.
The GNSS power consumption pattern is the same as figure 8.
Figure 11 shows the power consumption profile using the default accuracy parameters when the Tracker is indoors in static mode. When indoors, the GNSS scans don’t give results, so the location is done by Wi-Fi (For information on the scan strategy, see Tracker Application Capabilities).
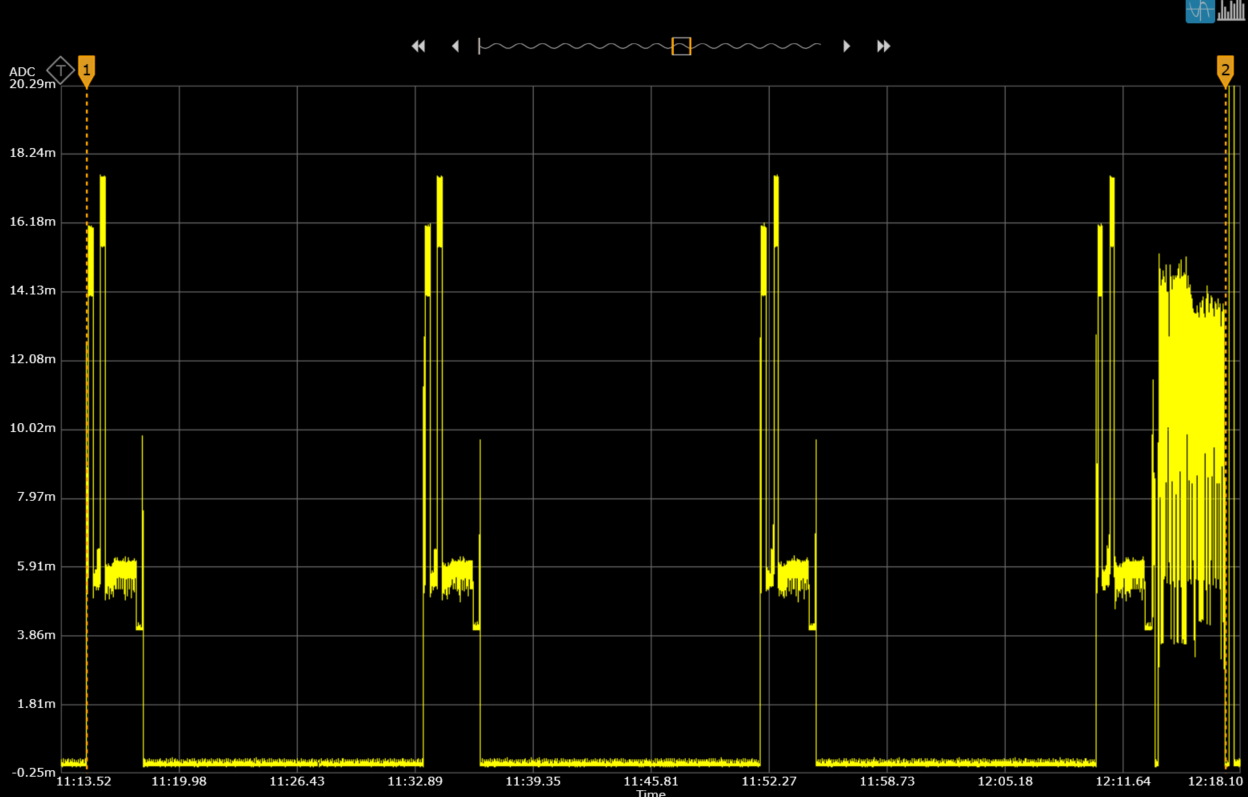
Figure 11: Power Consumption Profile Scan using Default Parameters in Static Mode, Indoor Case
The complete scan power consumption is about 2.16mA / 62.31s; therefore, 38.4μAh. If we split the power consumption by functionality, we get:
GNSS Scan: (7.26mA / 3.08s), corresponding to 6.21μAh per scan; in mobile mode we have four scans so 24.84μAh.
Wi-Fi: 12.05mA / 3.67s, corresponding to 12.2μAh.
Idle: 10.8μA.
Note
The power consumption varies depending on the number of Wi-Fi access points detected.
LoRaWAN transmissions are not treated here because they vary depending on the region used.
The difference between the total and the sum of all split parts is due to the idle state duration.
The GNSS power consumption pattern is the same as Figure 9.
LoRaWAN Transmissions
The LoRaWAN transmissions can vary following the payload and the nature of the data to send. Here is a example of a transmission containing GNSS data in mobile mode in the outdoors.
LoRaWAN Configuration:
ADR Custom List: Full SF9
RX2 DR: DR3 (in this case EU868 = SF9)
RX1 Delay: 5 secs
LoRaWAN number of retransmission: 3
Power Amplifier used: High Power
- Payload Assumption:
Payload to send: two NAV messages containing 10 satellites each, each NAV is sent by uplink.
This means the full transmission contains six uplinks; there are two NAV messages to send with a retransmission of three, meaning three uplinks per NAV message.
Figure 12 shows the power consumption profile of the LoRaWAN transmission in the conditions described above.
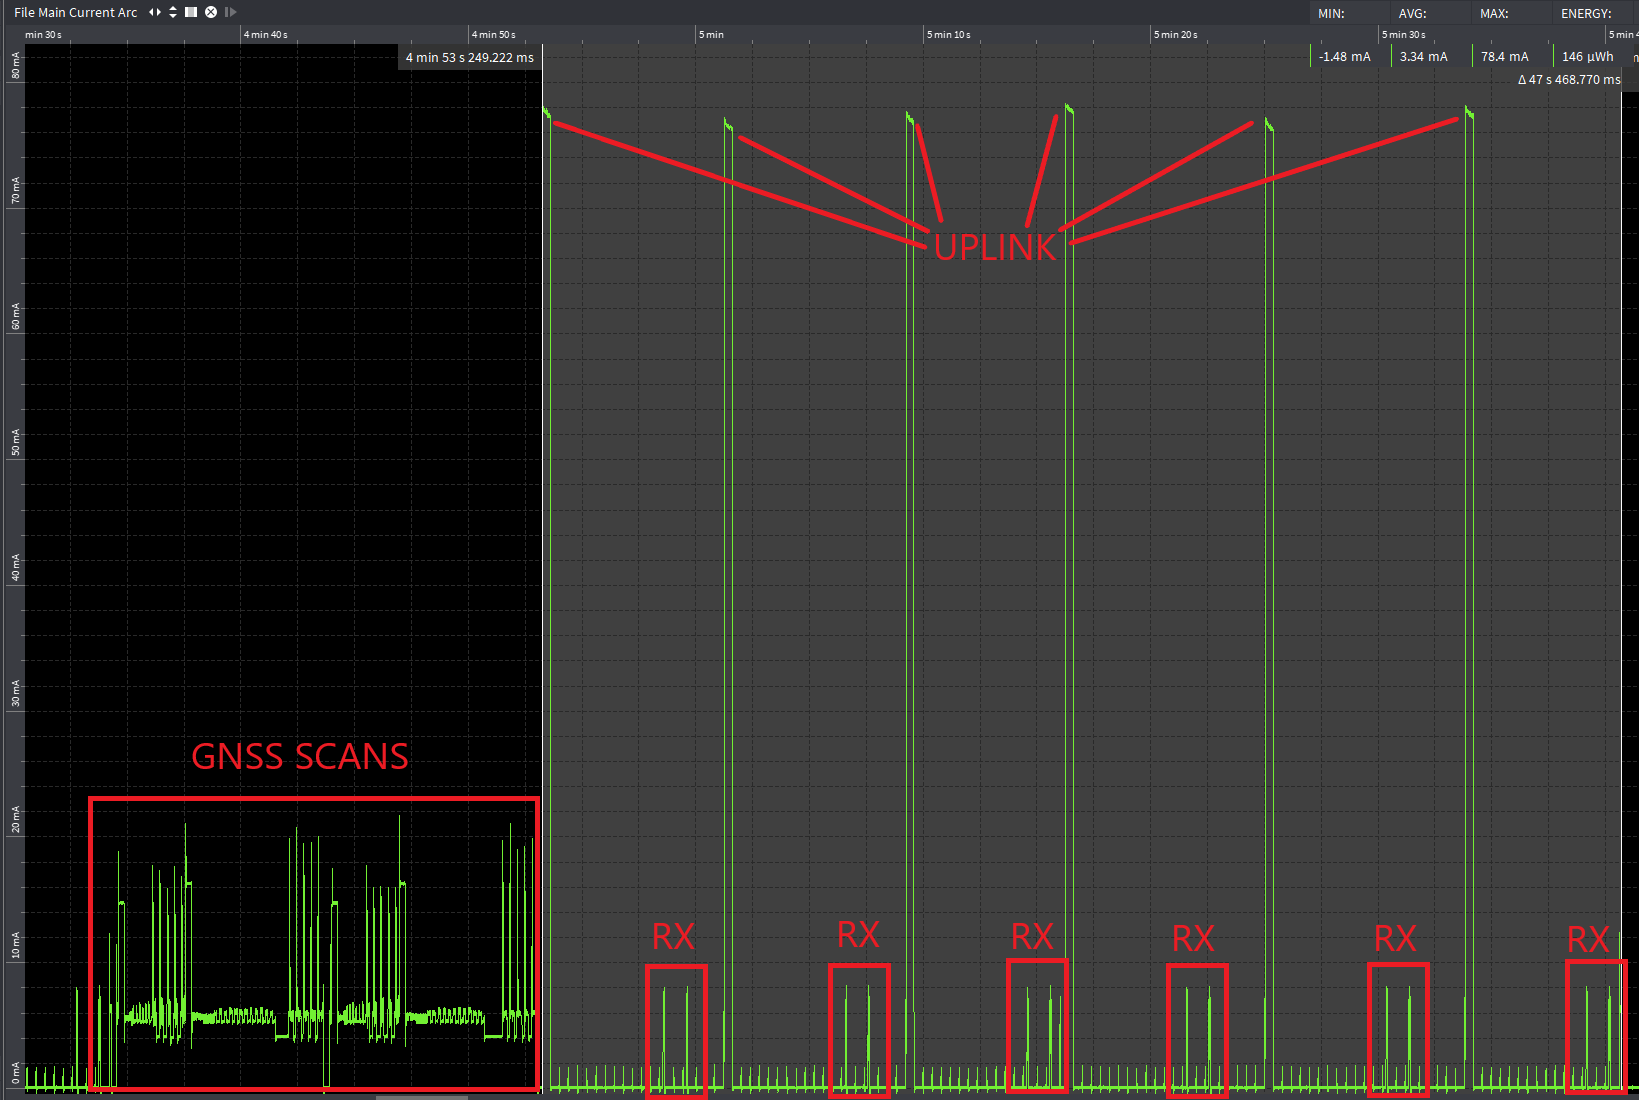
Figure 12: LoRaWAN Transmission Power Consumption to Send GNSS Location in Mobile Mode.
The complete transmission power consumption is about 3.36mA / 47s; therefore, 44μAh. If we split the power consumption by functionality, we get:
Transmission: 69.5mA / 368ms per uplink, corresponding to 7.1μAh per scan. There are six uplinks here, corresponding to 42.6μAh.
RX1/RX2: 4.6mA / 66.28s per RX window, here RX1 = RX2 = SF9. One RX window consumes 0.08μA, so the twelve RX windows here correspond to 1μAh.
Idle: 10.8μA.
Sleep Current
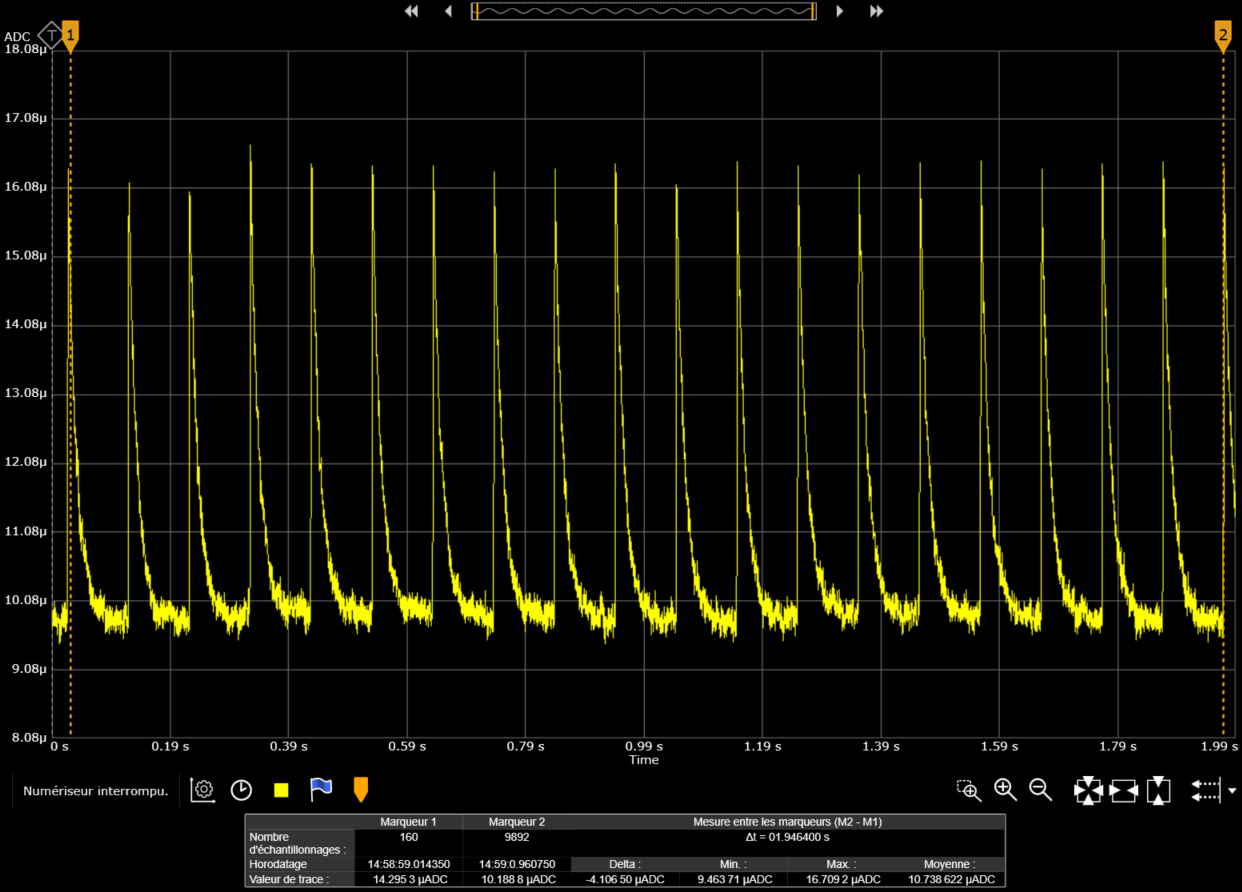
Figure 13: Power Consumption Profile in Sleep Mode
The average sleep current is approximately:
10.8μAh (without super-capacitors)
18.8μAh (with super-capacitors)
Each peak represents the accelerometer output data rate, here 100ms.
Antenna Performance
The antenna radiation patterns were measured in a free space condition. The measurement setup and device orientation are shown in Figure 13.
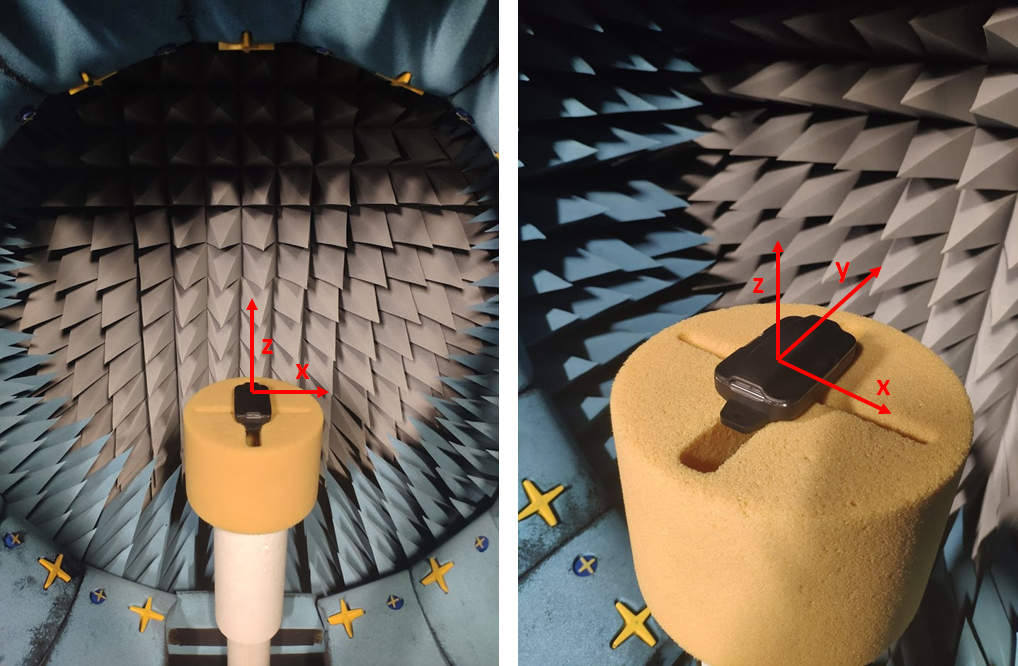
Figure 14: Radiation Diagram Measurement Setup
LoRa Antenna Radiation Pattern
The 3-D radiation pattern of the LoRa antenna of each Tracker type (868MHz and 915MHz) were measured at the antenna operating frequency, as shown in the following sections.
868MHz Antenna
The 3-D radiation pattern at 868MHz and the 2-D cuts in the various planes are shown in Figures 14-17.
TRP = 11.83dBm
EIRP = 13.84dBm
Efficiency = 46%
Gain = -1.36dBi
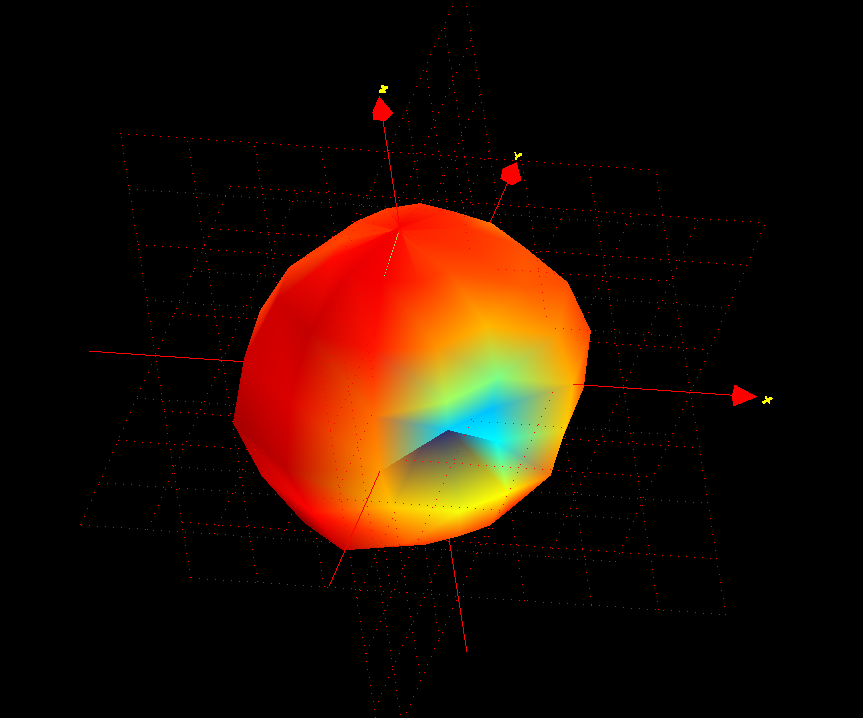
Figure 15: 3-D Pattern for Total Gain @ 868MHz
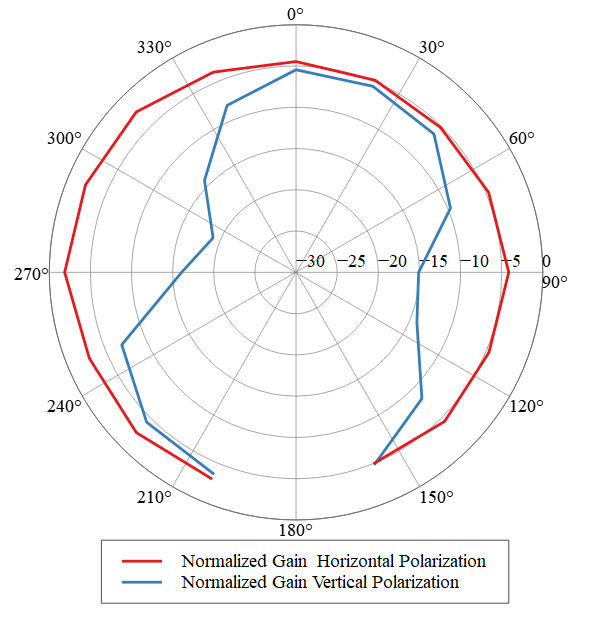
Figure 16: 2-D Radiation Pattern Planar Cut XoZ Plane @868MHz
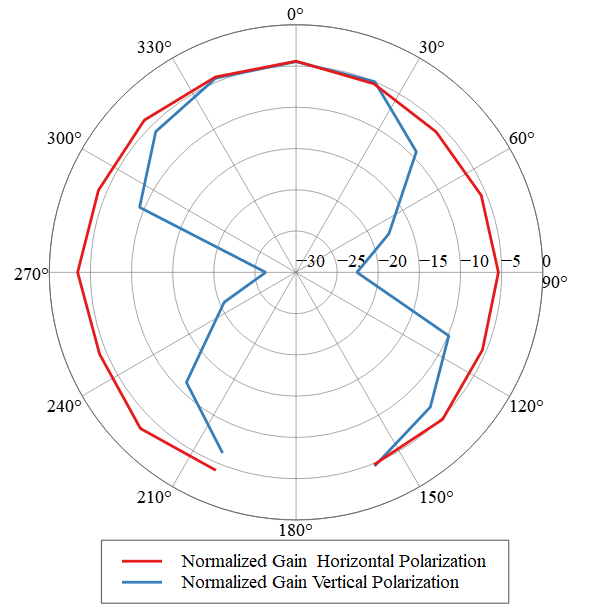
Figure 17: 2-D Radiation Pattern Planar Cut YoZ Plane @868MHz
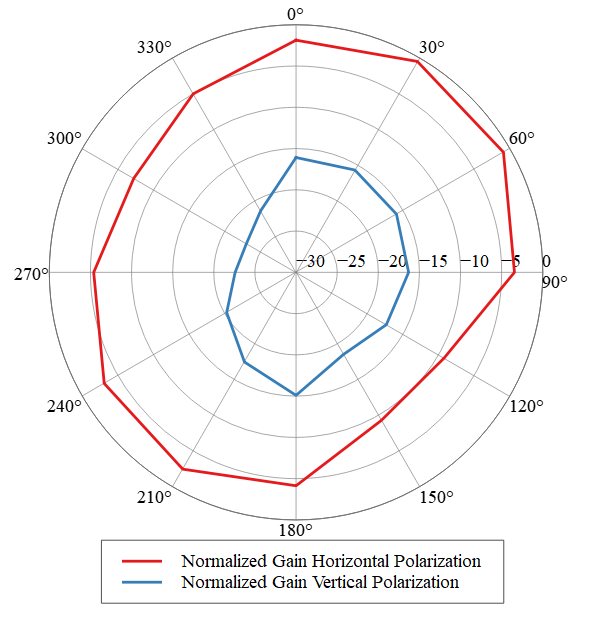
Figure 18: 2-D Radiation Pattern Planar Cut XoY Plane @868MHz
915MHz Antenna
The 3-D radiation pattern at 915MHz is shown in Figure 18, and the 2-D cuts in the various planes are shown in Figures 19-21.
TRP = 17.24dBm
EIRP = 19.41dBm
Efficiency = 40%
Gain = -1.73dBi
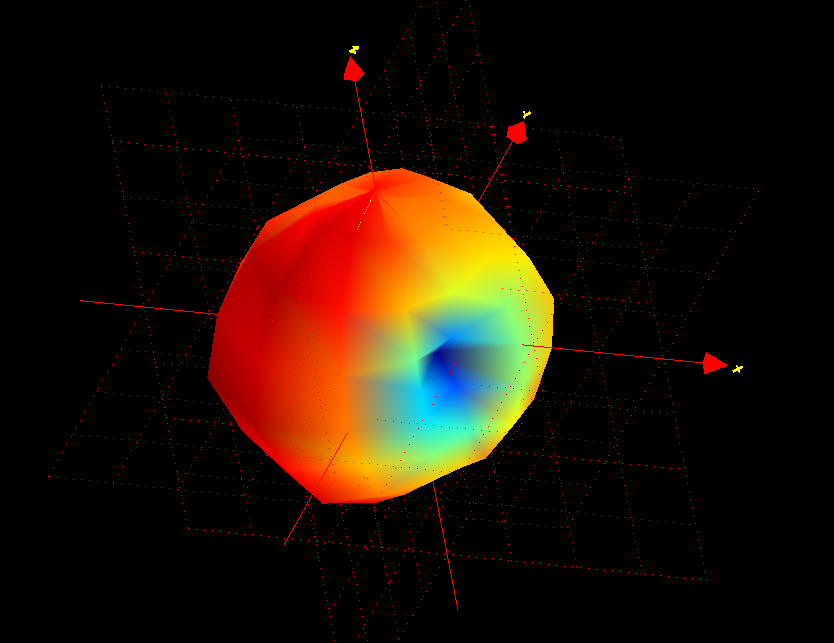
Figure 19: 3-D Pattern for Total Gain 915MHz
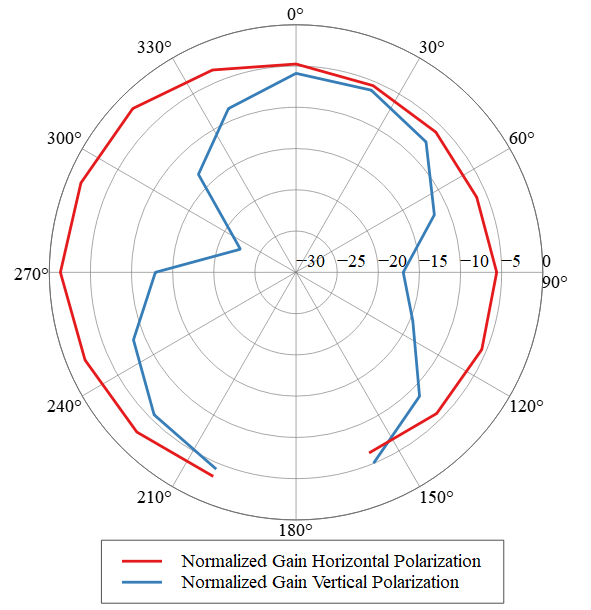
Figure 20: 2-D Radiation Pattern Planar Cut XoZ Plane @915MHz
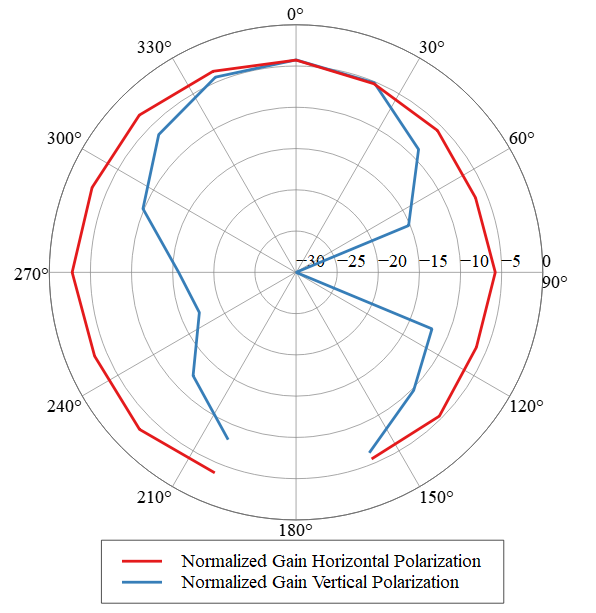
Figure 21: 2-D Radiation Pattern Planar Cut YoZ Plane @915MHz
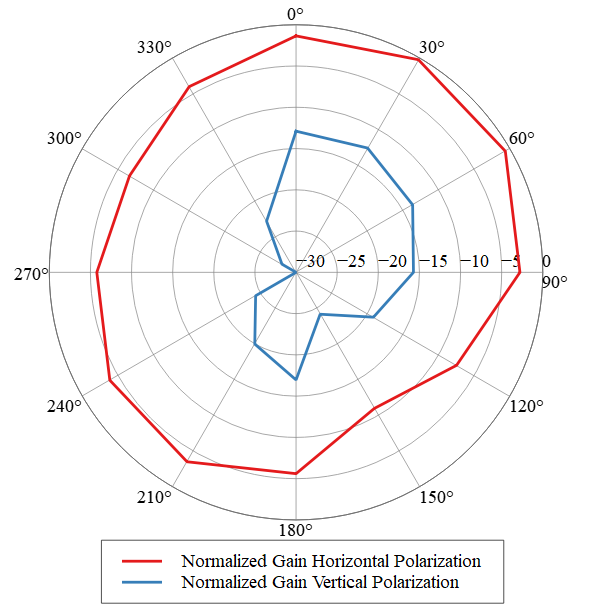
Figure 22: 2-D Radiation Pattern Planar Cut XoY Plane @915MHz
GNSS Antenna Radiation Pattern
The 3-D radiation pattern of the GNSS PCB antenna at 1.575GHz is shown in Figure 22.
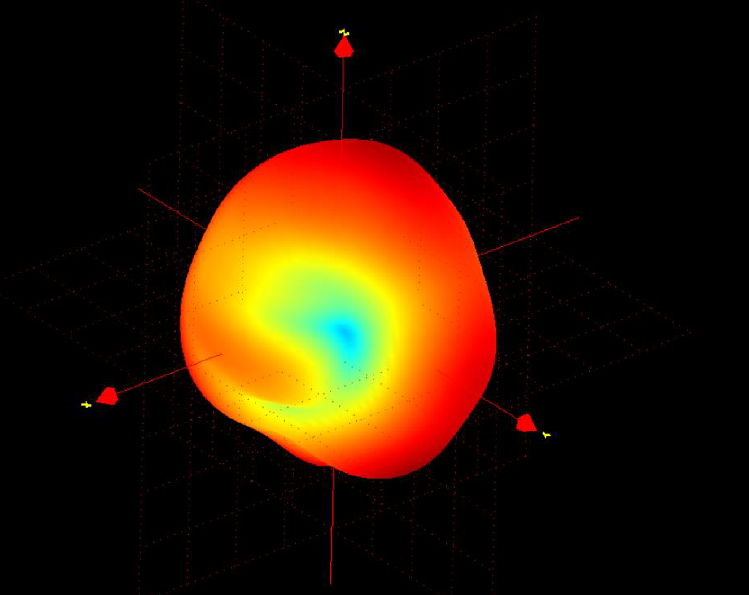
Figure 23: 3D Radiation Pattern of the GNSS PCB Antenna
2.4GHz Antenna Radiation Pattern
The 3-D radiation pattern of the 2.4GHz antenna at 2440MHz is shown in Figure 23, whereas the 2D cuts in the various planes are shown in Figures 24-26.
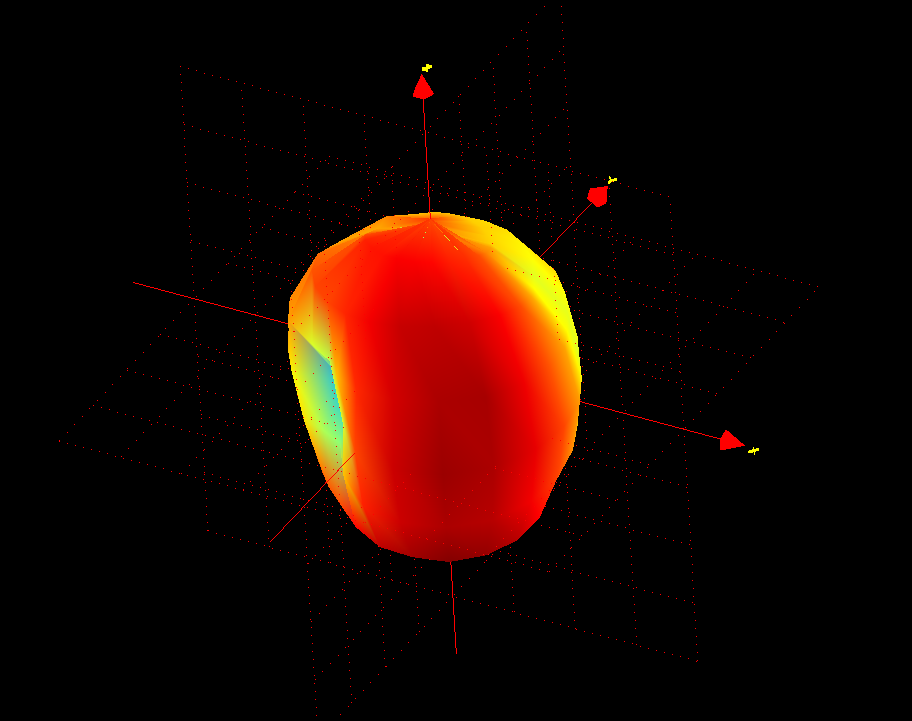
Figure 24: 3D Pattern for Total Gain @2440MHz
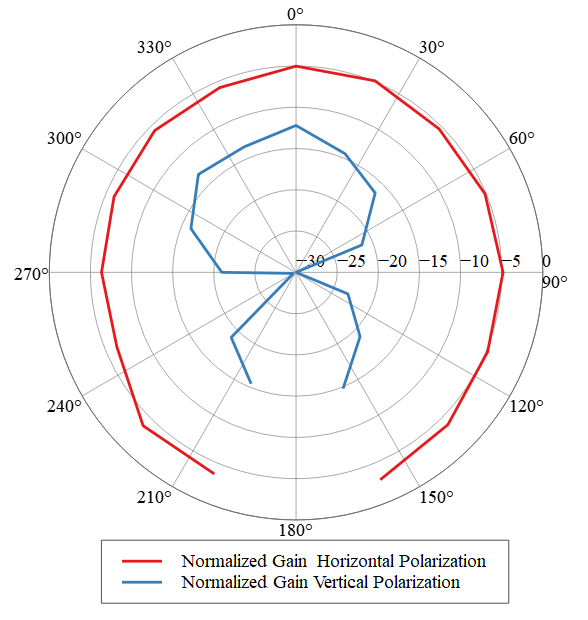
Figure 25: 2-D Radiation Pattern Planar Cut XoZ Plane @2440MHz
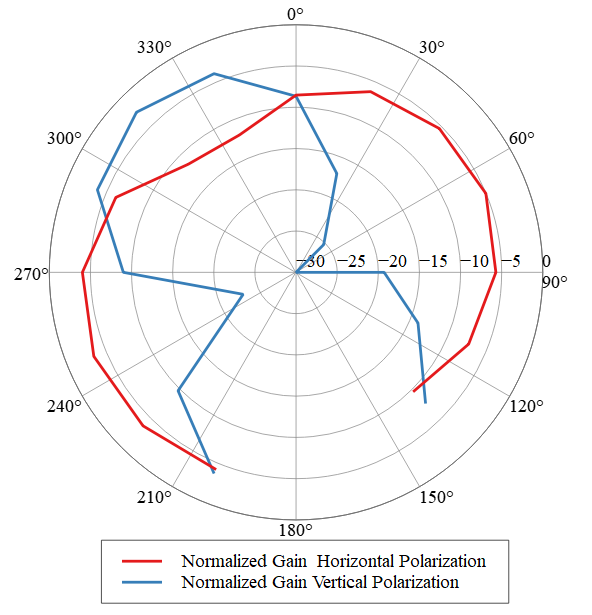
Figure 26: 2-D Radiation Pattern Planar Cut YoZ Plane @2440MHz
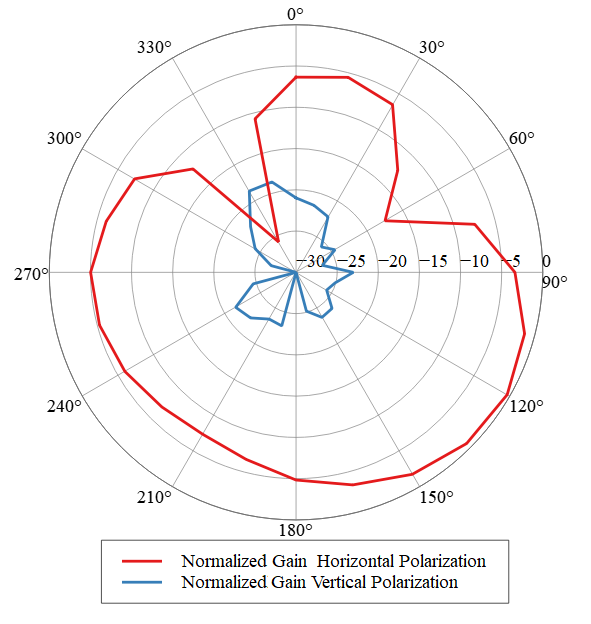
Figure 27: 2-D Radiation Pattern Planar Cut XoY Plane @2440MHz
QR Code Description
The QR code printed on the device label integrates the Device ID in the QR code, as defined by the LoRa Alliance®.

Figure 28: EU Label

Figure 29: U.S. Label
The QR code contains the following information:
Preface: LW
SchemaID: D0
JoinEUI:(00-16-C0-01-FF-FE-00-01 in this example)
DevEUI: (00-16-C0-01-F0-00-14-9A in this example)
ProfileID: 016A-0001
OwnerToken: 4A21235D: pin of the LR1110
SerNum of Mfg Serial Number: YYWWNNNNNN (Year, Week, Serial Number)
Proprietary: US915 (for U.S.), EU868 (for EU)
CheckSum: (CRC-16/MODBUS)
- The information contained in the QR code represents 58 bytes of data:
LW:D0:0016C001FFFE0001:0016C001F000149A:016A0001:O4A21235D:S2126220290:PEU868
- With the CRC, we have 64 bytes of data:
LW:D0:0016C001FFFE0001:0016C001F000149A:016A0001:O4A21235D:S2126220290:PEU868:C7ECF
For more information, see TR005 LoRaWAN® Device Identification QR Codes.