build
Checking Test Results
Result Output Format
Test results are generated in HTML and open in a new window.
All results are presented by a web server that is accessible from any browser.
Device Page
To view a list of all devices under test, enter the following URL:
|
http://IP/device |
A list of devices appears on the page.
Note: For security reasons, some information is masked in the following example:
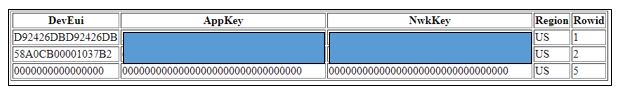
Figure 6: Device information page
Test Case Summary Page
To view all test cases (sequences) and whether they are scheduled, ongoing or finished, enter the following URL:
|
http://IP/result |
A list of scheduled, ongoing and finished tests appears.
For all finished tests, the result also appears, as shown in the first three data rows below.
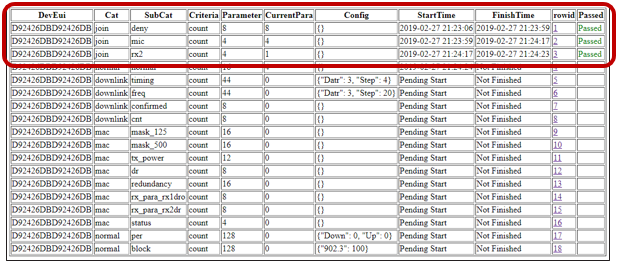
Figure 7: Test Case page
Test Information Page
In your browser’s address bar, enter the following URL, where
|
http://IP/result/testid= |
If you click the link in the list of test cases to open this page, items defaults to verification,which shows the information of different checkpoints and whether the DUT passed those checkpoints. For selected tests, some detailed information also appears with the “verification” item.
Including RSSI, the Test Bench supports a total of 23 available pages for visualizing data (marked from 1 to 23 in the list below).
- rssi: RSSI data reported by the gateway.
- lsnr: LoRa signal-to-noise ratio (SNR) information and statistics reported by the gateway.
- Freq: Carrier frequency of the uplink packets.
- Size: Physical layer payload size for uplink packets (in bytes).
- datr: LoRa data rates used for uplink packets.
- toa: LoRa packet time on-air information and duty-cycle information.
- MType: Message type information.
- FCnt: Frame count for uplink confirmed or unconfirmed data frames.
- ACK: Acknowledgment information for both uplink and downlink data frames.
- mac: The MAC command trace on uplink or downlink packets.
- FPort: Application FPort information in uplink data packets.
- FRMPayload: Application layer frame payload on uplink data frames.
- FRMPayload_length: Application payload frame length for uplink frames (in bytes).
- time_diff: Time difference on adjacent uplink packets.
- FCnt_diff: Frame count difference on adjacent uplink data frames.
- log: Detailed logging information for all packets related to the device.
- rssi-freq: The correlation of frequency and RSSI. This is used to investigate the RSSI distribution on different frequency channels, so the quality of various channels can be ascertained.
|
|
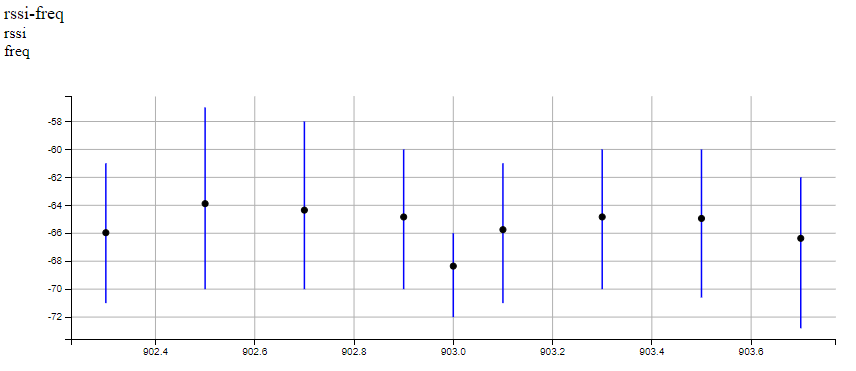
Figure 8: Example of rssi-freq correlation page
In the example shown in Figure 8, the upper end of the vertical blue lines represents the 90th percentile of the RSSI grouped by the x-axis value (channel frequency). The lower end represents the 10th percentile. The black dot represents the average value.
- lsnr-freq: The correlation of frequency and SNR. It is used to investigate the SNR distribution on different frequency channels, so the quality of various channels can be ascertained.
- rssi-toa: The correlation of time on air (TOA) and RSSI. This is used to investigate the RSSI distribution of the packets of different on-air times. It helps to qualify the DUT hardware design.
- lsnr-toa: The correlation between TOA and SNR. This is used to investigate the SNR distribution of the packets of different on-air time. It helps to qualify the DUT hardware design.
- current: Current consumption during the test.
|
|
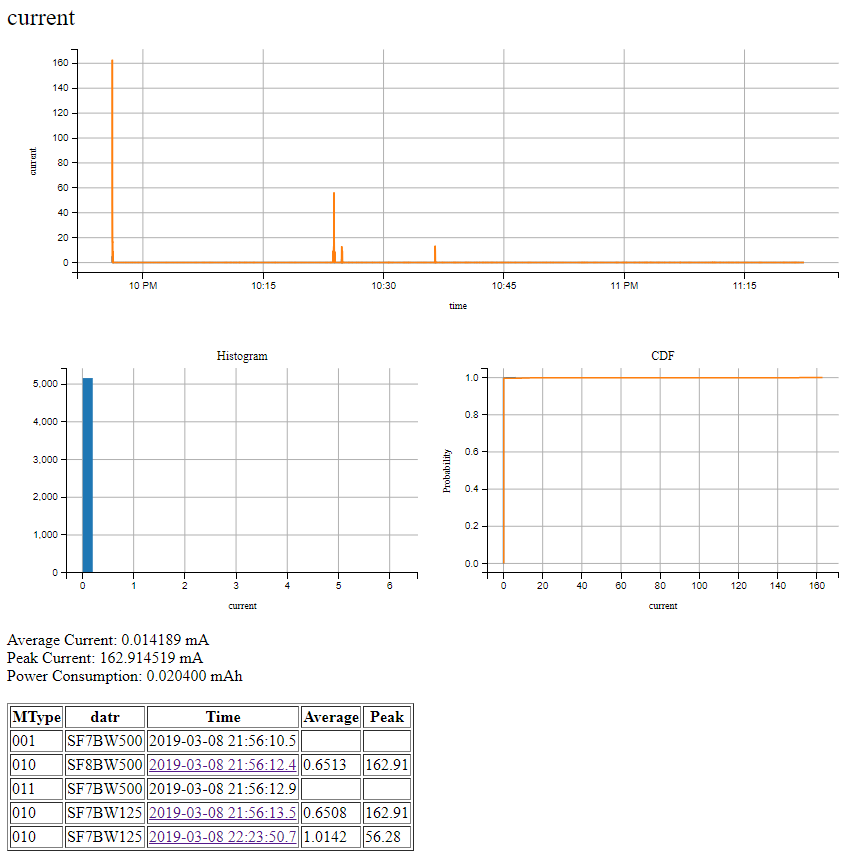
Figure 9: Example of current consumption page
As shown in Figure 9, the current profile, distribution and CDF measurements are plotted at one-second intervals.
All the packets logged appear in the table. To view a detailed, high-resolution, current profile, click the link under Time in the grid at the bottom left of the screen. The default span for the inspection is from -5 to +10 seconds of the uplink packet.
Figure 10 provides an example of a packet current profile:
|
|
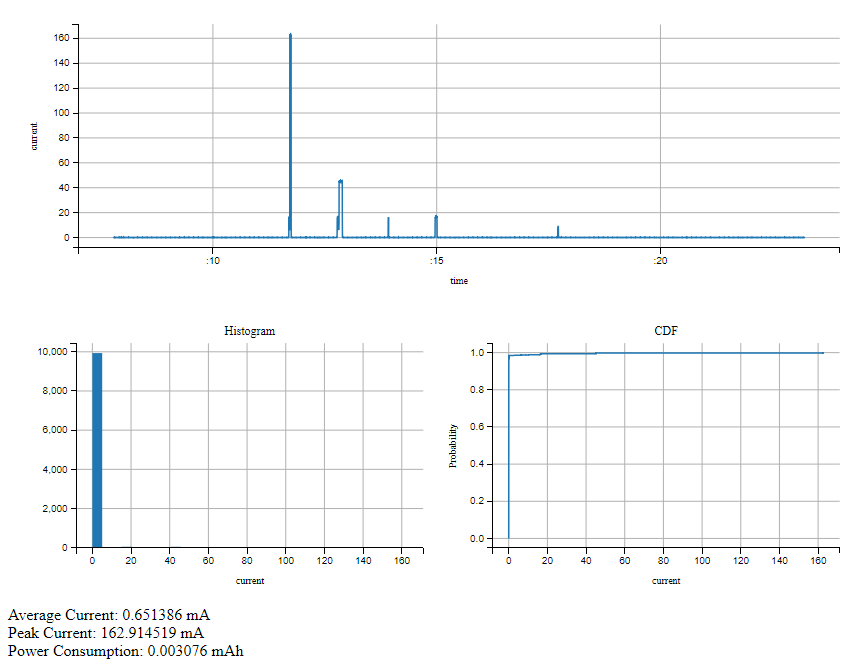
Figure10: Example of packet current profile
- delay: This is the network delay information. Three delays are measured:
- Round-trip transmission time between the proxy and the test controller
- Round-trip transmission time between the packet forwarder and the proxy
- Round-trip transmission time between the network server and the proxy
The first graph on the Delay information page illustrates the latency over time. The second graph shows the distribution of the delays over the duration of the test.
|
|
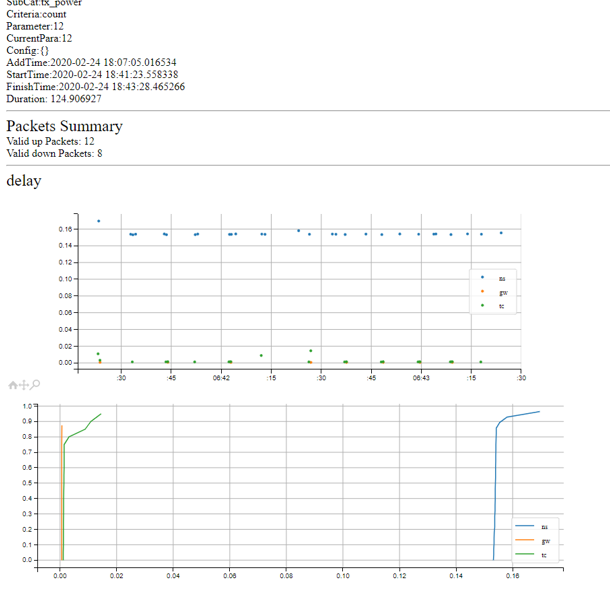
Figure 11: The "Delay" information page
- print: Opens the print console. Use this command if you want to print the test results page or save it as PDF. To print the test results, enter print at the end of the list of items
items. To save it as a PDF, select a PDF printer in the print console.
Note: This page supports “zooming” and “panning.”
You can cascade multiple supported items on the same page using the plus sign (+). For example, to find information about the first test on frequency, RSSI and current consumption, navigate to:
|
http://IP/result/testid=1/freq+rssi+current |
Figure 12 shows an example of the detailed test results page.
|
|
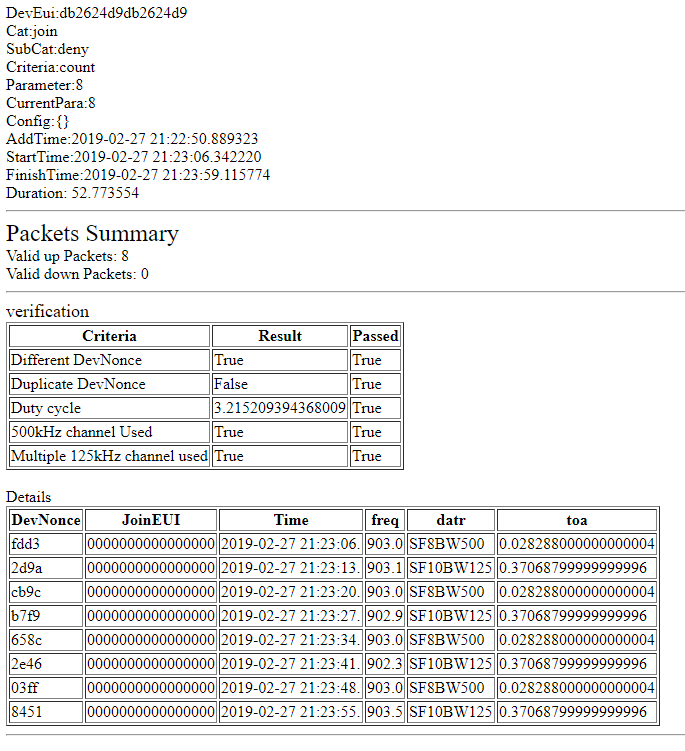
Figure12: Detailed test page (default)
Note: If items is not verification, replace the items
Note: Each
|
|
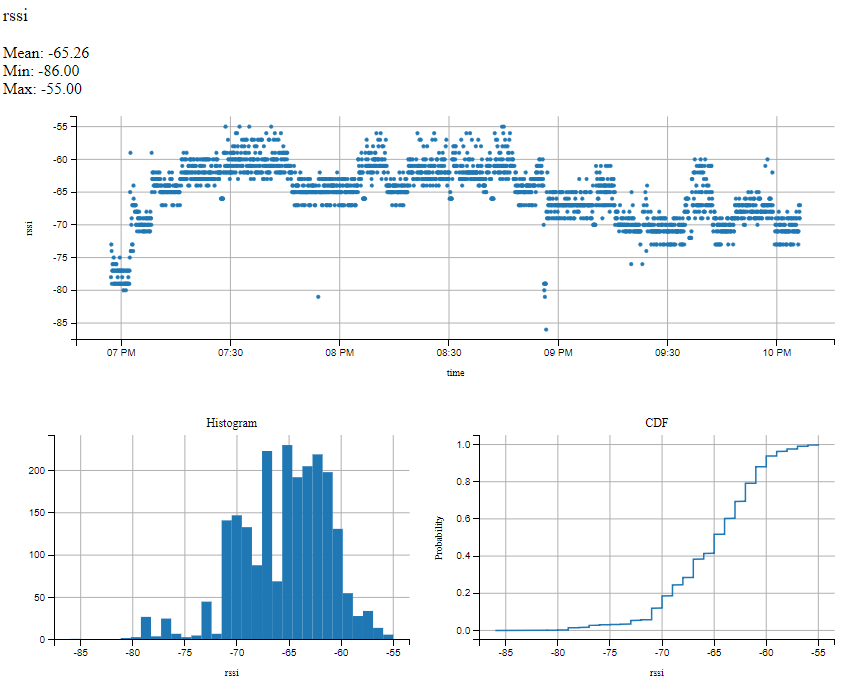
Figure 13: Example of RSSI page
The value over time, histogram, and cumulative distribution function (CDF) curve are all plotted on this page. Zoom and pan features are supported.
General Packet Page
Even without predefined test cases, the Test Bench will act as a sniffer to find and save the following information:
DevEUI: Device EUI of the device under test (DUT) startTime: Starting timestamp of the inspection period, as a Unix Time Stamp (float number)duration: Duration of the inspection period, in secondsitems: Aspects to be presented;, see the List ofitems Items section
To retrieve this information, enter:
|
http://IP/packet/device/DevEui |
General Current Page
You can check the current consumption of the DUT without a test case definition.
While fetching the current profile, the server pulls a large amount of information from memory into the database. The time to process this data can take up to one minute.
Two sampling rates are supported:
- High sampling rate profile
- Long duration profile (Low sampling rate)
To check the profile for less than one minute use the high sampling rate mode. To check the profile for longer than one minute use the long duration mode.
High Sampling Rate Profile
For a high-resolution profile (at about 670 SPS), the Test Bench can retrieve the current profile during the transmission and reception periods. Enter the following in your browser’s address bar:
|
http://IP/current/1/ |
startIme: Starting timestamp of the inspection period, as a Unix Time Stamp (float number). You can use external resources[1] to convert the date to a time stamp.duration: Duration of the inspection period, in seconds
Long Duration Profile
To observe power consumption over a long span of time (1SPS), use a low-resolution profile. In the address bar of your browser enter the following URL:
|
http://IP/current/0/startTime+duration |
startTime: Starting timestamp of the inspection period, in Unix Time Stamp (float number)duration: Duration of the inspection period, in seconds
If the duration is more than 86,400 seconds (one day), the resolution is automatically decreased to one sample per minute (1/60 SPS).
Similarly, you can retrieve the latest current consumption data from either of the following URLs:
|
http://IP/current/0/last/time |
or
|
http://IP/current/1/last/time |
- time the current profile duration to be retrieved, in seconds